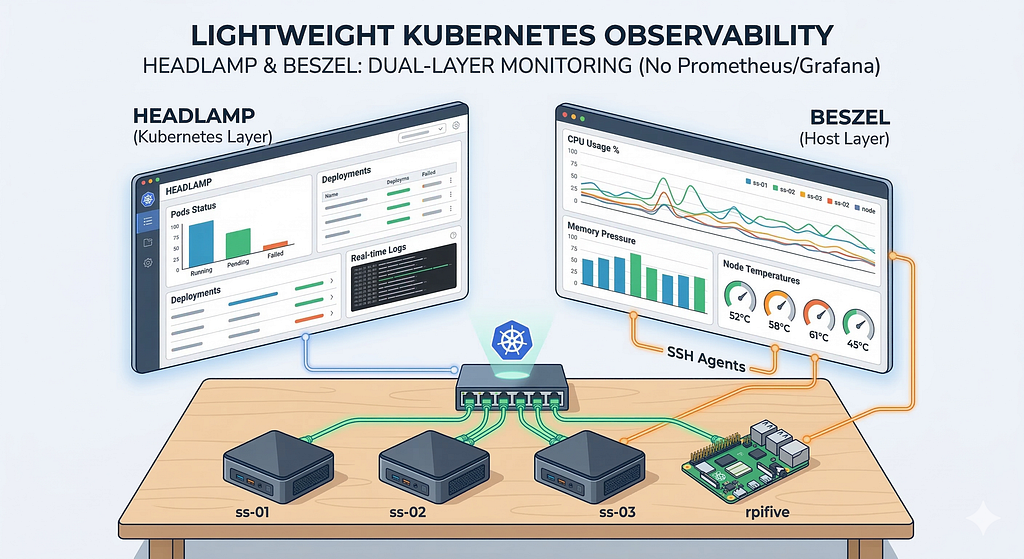
No Prometheus. No Grafana. No YAML hell. Just two lightweight tools that give you everything you need to monitor a homelab cluster.
I have a 4-node Kubernetes cluster running on my desk. Three mini PCs and a Raspberry Pi 5, managed by MicroK8s, running CI/CD pipelines and soon serving applications. After getting the cluster stable, secrets flowing from GCP, and GitLab Runners executing jobs, the next question was obvious: how do I know when something breaks?
The default answer in the Kubernetes world is Prometheus + Grafana. It’s powerful, battle-tested, and complete overkill for a homelab. Prometheus alone needs persistent storage, scrape configs, service monitors, and enough RAM to store time-series data. Grafana needs its own database, dashboard provisioning, and data source configuration. You end up spending more time monitoring the monitoring stack than monitoring your actual workloads.
I went a different route: Headlamp for the Kubernetes layer and Beszel for the host layer. Two tools, two purposes, zero overlap in what matters. This post covers why I picked them, how I set them up, what went wrong, and what I’d do differently.
Why Two Tools?
A Kubernetes cluster has two layers you need visibility into, and they’re completely different:
The Kubernetes layer — what’s running in the cluster. Pods, deployments, services, secrets, events, logs. This is the application-level view. When a deployment fails to roll out or a pod is stuck in CrashLoopBackOff, this is where you look.
The host layer — what’s happening on the actual machines. CPU temperature, disk health, memory pressure, network throughput, container resource usage. When the cluster feels sluggish or a node goes NotReady, this is where you look.
Prometheus + Grafana covers both, but it’s a single monolithic stack that requires significant operational overhead. By splitting the two concerns into purpose-built tools, I get better visibility with less maintenance.
┌─────────────────────────────────────────────┐
│              Your Laptop Browser             │
│                                              │
│   headlamp.lan          beszel.lan           │
│   (K8s dashboard)       (Host monitoring)    │
└──────┬──────────────────────────┬────────────┘
       │                          │
       ▼                          ▼
┌──────────────┐    ┌──────────────────────────┐
│  Headlamp    │    │     Beszel Hub           │
│  (in-cluster)│    │     (in-cluster)         │
│              │    │                          │
│ Talks to K8s │    │  Agents on bare metal:   │
│ API server   │    │  ss-01, ss-02, ss-03,    │
│              │    │  rpifive                 │
└──────────────┘    └──────────────────────────┘Code language: CSS (css)
Headlamp: The Kubernetes Dashboard
What It Is
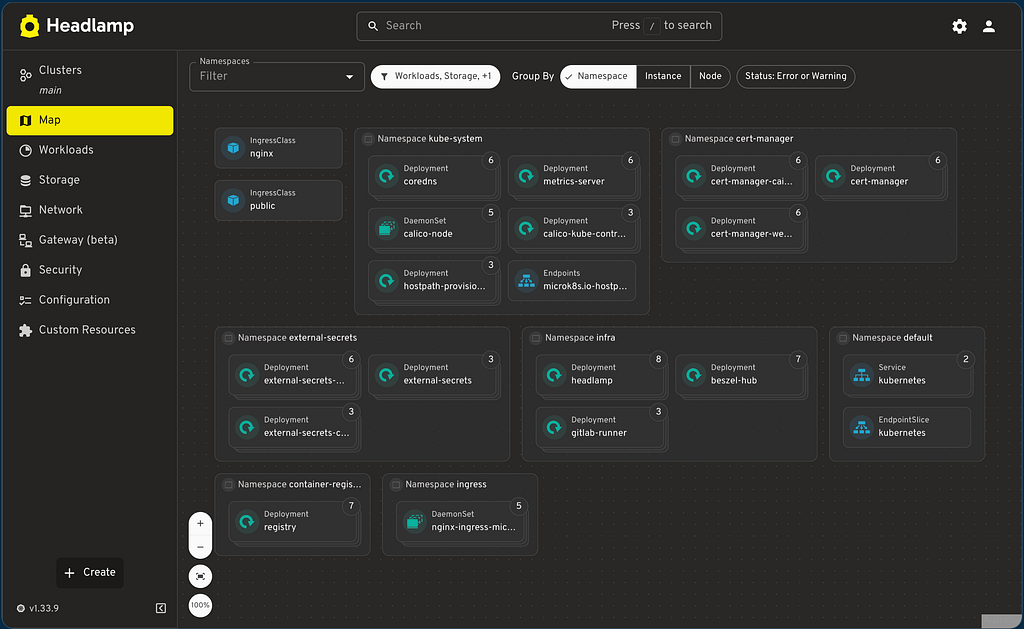
Headlamp is a Kubernetes web UI maintained under Kubernetes SIG UI. It’s the spiritual successor to the old Kubernetes Dashboard, but built with React, extensible via plugins, and actually pleasant to use. It connects directly to the Kubernetes API server and respects RBAC — you only see what your token allows.
Why Not the Default MicroK8s Dashboard?
The MicroK8s dashboard addon installs the original Kubernetes Dashboard. It works, but the interface feels dated, search is limited, and there’s no plugin system. Headlamp gives you a modern UI with features like CRD browsing, log streaming, resource editing, and an extensible plugin system — all in a single deployment.
As someone new to the Kubernetes ecosystem, I also appreciate the map mode that allows me to explore and keep track of the many deployments I will make here.
Installation
Headlamp installs via Helm into the cluster. I put everything in an infra namespace that houses all my cluster tooling.
helm repo add headlamp https://kubernetes-sigs.github.io/headlamp/
helm repo update
helm upgrade --install headlamp headlamp/headlamp --namespace infraCode language: PHP (php)
The session-ttl bug: As of chart version 0.40.1, there’s a known bug where the Helm chart passes a -session-ttl flag that the binary doesn’t recognize. The pod will CrashLoopBackOff with this error:
flag provided but not defined: -session-ttlThe fix is to patch the deployment after install and remove the offending flag:
kubectl get deploy headlamp -n infra -o json | \
  jq '.spec.template.spec.containers[0].args |= map(select(. != "-session-ttl=86400"))' | \
  kubectl apply -f -Code language: JavaScript (javascript)
This is a chart bug, not a Headlamp bug. Check the GitHub issue tracker before installing — it may be fixed by the time you read this.
Authentication
Headlamp uses Kubernetes service account tokens for authentication. Create a dedicated service account with cluster-admin access:
kubectl create serviceaccount headlamp-admin -n infra
kubectl create clusterrolebinding headlamp-admin \
  --clusterrole=cluster-admin \
  --serviceaccount=infra:headlamp-admin
kubectl create token headlamp-admin -n infra --duration=8760h
That gives you a token valid for a year. Save it in a password manager. You’ll paste it into the Headlamp login screen on each new browser session.
For a homelab, this is fine. For a team, you’d set up OIDC authentication with Google or another provider so people log in with their identity rather than a shared token.
Exposing It on the LAN
I use MicroK8s’s built-in nginx ingress controller to expose Headlamp on the local network. A Pi-hole instance handles local DNS resolution.
First, add a DNS record in Pi-hole (Settings → dns.hosts):
192.168.0.121 headlamp.lanCode language: CSS (css)Don’t use .local — it’s reserved for mDNS and will conflict with regular DNS resolution, returning SERVFAIL. Use .lan, .home, or .internal instead.
Then create an Ingress:
apiVersion: networking.k8s.io/v1
kind: Ingress
metadata:
  name: headlamp
  namespace: infra
spec:
  ingressClassName: nginx
  rules:
    - host: headlamp.lan
      http:
        paths:
          - path: /
            pathType: Prefix
            backend:
              service:
                name: headlamp
                port:
                  number: 80
Open http://headlamp.lan in any browser on the LAN, paste the token, and you’re in.
What You Get
Once logged in, Headlamp gives you a full view of the cluster: all namespaces, nodes, workloads, network resources, storage, RBAC, events, and CRDs. You can stream pod logs, exec into containers, edit resources, and browse custom resources like ExternalSecrets. The search is fast, and the navigation is intuitive.
It doesn’t do alerting, it doesn’t store metrics history, and it doesn’t monitor host-level resources. That’s not its job. It’s a dashboard for operating your cluster, and it does that well.
Beszel: The Host Monitor
What It Is
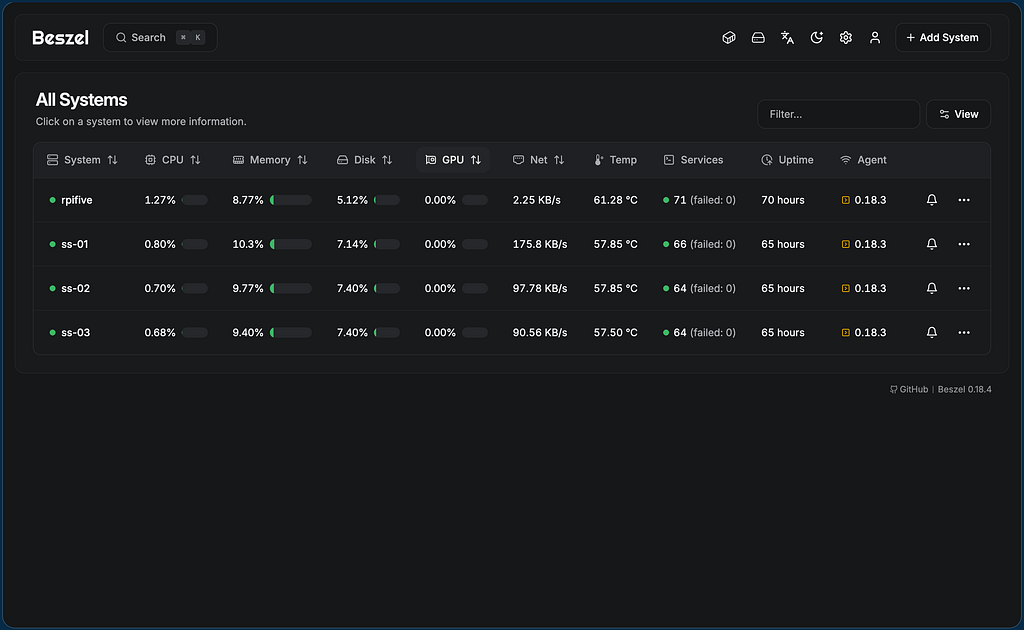
Beszel is a lightweight server monitoring platform built on PocketBase. It uses a hub-and-agent model: one hub serves the dashboard, and agents on each machine collect and report system metrics over SSH.
Why Not Prometheus + Node Exporter?
Prometheus + Node Exporter + Grafana is the standard stack for host monitoring in Kubernetes environments. It’s incredibly powerful and completely unnecessary for four machines. The Node Exporter alone exposes hundreds of metrics per node. You need to configure scrape intervals, retention policies, storage backends, and Grafana dashboards to make any of it useful.
Beszel gives you CPU, memory, disk, network, temperature, and container stats with a beautiful UI out of the box. The agent uses about 10MB of RAM. There’s no configuration beyond the SSH key exchange. It stores historical data automatically and has built-in alerting. For a homelab, the value-to-complexity ratio is unbeatable.
Architecture Decision: Agents as Binaries, Not Containers
I initially considered running Beszel agents as a Kubernetes DaemonSet. The appeal is obvious — managed by Kubernetes, auto-restarts, easy updates. But Beszel’s entire purpose is monitoring the host, and running it inside a container creates a layer of indirection that defeats the point.
Container-based agents need hostNetwork: true, socket mounts for containerd, and tolerations for tainted nodes. Even then, they can’t reliably access disk S.M.A.R.T. data, temperature sensors, or all network interfaces. The agent is a single Go binary that uses 10MB of RAM — there’s no meaningful benefit to containerizing it.
The hub runs in Kubernetes because it’s a web dashboard that benefits from ingress, service discovery, and lifecycle management. The agents run as systemd services on each host because they need to see the real machine.
Hub (K8s pod in infra namespace)
  │
  │  SSH connections
  │
  ├── ss-01 agent (systemd service)
  ├── ss-02 agent (systemd service)
  ├── ss-03 agent (systemd service)
  └── rpifive agent (systemd service)Code language: PHP (php)
Installing the Hub
The hub runs as a simple Deployment with a Service and Ingress:
apiVersion: apps/v1
kind: Deployment
metadata:
  name: beszel-hub
  namespace: infra
spec:
  replicas: 1
  selector:
    matchLabels:
      app: beszel-hub
  template:
    metadata:
      labels:
        app: beszel-hub
    spec:
      containers:
        - name: beszel
          image: henrygd/beszel:latest
          ports:
            - containerPort: 8090
          volumeMounts:
            - name: data
              mountPath: /beszel_data
      volumes:
        - name: data
          emptyDir: {}
---
apiVersion: v1
kind: Service
metadata:
  name: beszel-hub
  namespace: infra
spec:
  selector:
    app: beszel-hub
  ports:
    - port: 80
      targetPort: 8090
---
apiVersion: networking.k8s.io/v1
kind: Ingress
metadata:
  name: beszel
  namespace: infra
spec:
  ingressClassName: nginx
  rules:
    - host: beszel.lan
      http:
        paths:
          - path: /
            pathType: Prefix
            backend:
              service:
                name: beszel-hub
                port:
                  number: 80
Note the emptyDir volume for data. This means Beszel’s historical data is lost if the pod is rescheduled. For a homelab where I can rebuild everything in 20 minutes, this is acceptable. If you want persistence, use a hostPath volume or a PVC.
After applying, open http://beszel.lan and create an admin account with email and password. Beszel supports OAuth/OIDC, but that requires a callback URL that external providers can reach — not practical on a .lan domain.
Installing Agents
Download and run the install script on each node:
curl -sL https://get.beszel.dev -o /tmp/install-agent.sh && chmod +x /tmp/install-agent.sh && sudo /tmp/install-agent.sh -k "YOUR_SSH_PUBLIC_KEY"Code language: JavaScript (javascript)The SSH key is displayed in the Beszel UI when you click “Add System.” Each agent gets the same key — it’s the hub’s public key, used for the agent to authenticate the hub’s SSH connection.
Important: Don’t pipe the script directly to bash (curl | bash). On some systems, this causes function resolution errors. Download it first, make it executable, then run it.
Important: When the script asks for a key, give it the SSH public key from the “Add System” dialog, not the universal token from the settings page. The universal token is for agent self-registration — a different mechanism. Getting these mixed up results in the agent crashing with “Failed to load public keys” in the logs.
After installing agents on all nodes, add each system in the Beszel UI using its IP address (not hostname). The hub runs inside a Kubernetes pod, which uses CoreDNS — it can’t resolve mDNS .local hostnames.
SystemHostPortss-01192.168.0.12145876ss-02192.168.0.11945876ss-03192.168.0.245876rpifive(node IP)45876
What You Get
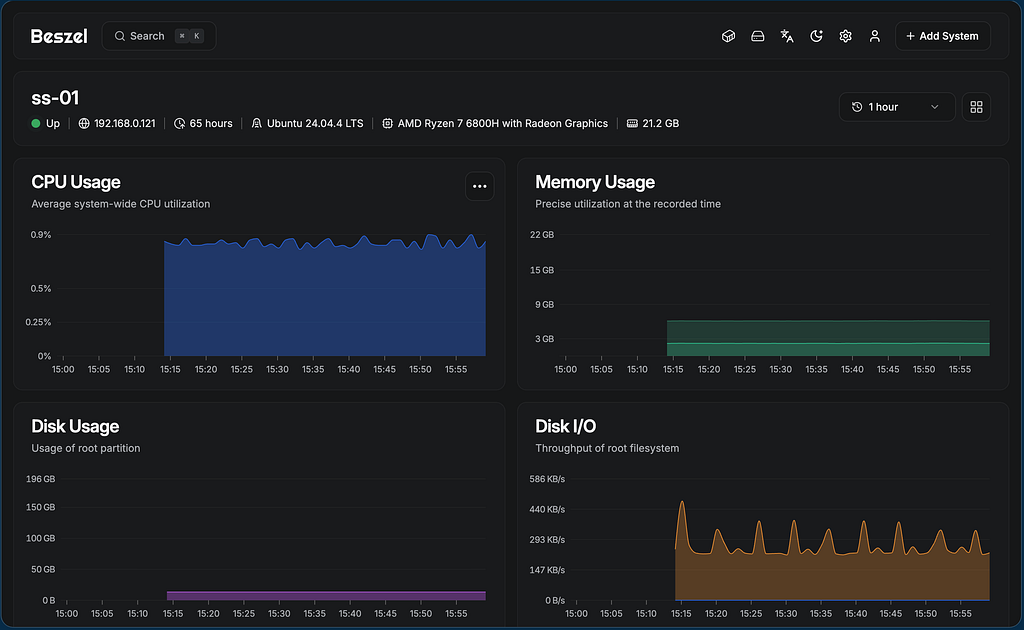
Once all agents are connected, the Beszel dashboard shows every node at a glance: CPU usage, memory, disk, network throughput, load average, temperature, and container stats. You can click into any node for historical charts, set up alerts for thresholds (CPU > 90%, disk > 80%), and see all running containers with per-container resource usage.
The temperature monitoring alone justified the setup for me. Three mini PCs in a cluster generate heat, and knowing their operating temperatures helps me decide if I need better airflow before something throttles.
Local DNS with Pi-hole
Both dashboards are exposed via Kubernetes Ingress on hostnames. For these to resolve on LAN devices, I use a Pi-hole instance (running on a separate Raspberry Pi 4) as the local DNS server.
In Pi-hole v6 (Settings → dns.hosts), add:
192.168.0.121 headlamp.lan
192.168.0.121 beszel.lanCode language: CSS (css)
Point these to any node IP where the nginx ingress controller runs. Since ingress is deployed as a DaemonSet, it runs on all three x86 nodes — any of their IPs will work.
Don’t use .local as the domain suffix. The .local TLD is reserved for Multicast DNS (mDNS/Bonjour). Standard DNS resolvers will return SERVFAIL for .local queries. Use .lan, .home, or .internal instead.
Things You Need to Get Right
Headlamp
- Chart version 0.40.1 has a session-ttl bug. The pod will CrashLoopBackOff. Patch the deployment to remove the -session-ttl flag until the chart is fixed upstream.
- RBAC matters. If you delete and recreate a service account, you need to recreate the ClusterRoleBinding too. The old binding points to the old service account UID. Symptoms: Headlamp loads but shows “You don’t have permissions to view this resource” for everything.
- Token management. Tokens created with kubectl create token can’t be individually revoked. To invalidate a token, delete the service account and recreate it. All tokens issued for that SA become invalid.
Beszel
- Hub uses CoreDNS, not your LAN DNS. When adding systems in the Beszel UI, always use IP addresses. Hostnames like ss-01.local won’t resolve from inside the Kubernetes pod.
- SSH key vs. universal token. The install script wants the SSH public key (starts with ssh-ed25519). The universal token (a UUID) is for a different self-registration mechanism. Mixing them up is the most common agent startup failure.
- Agent install script — download first, don’t pipe. curl | bash can fail with function resolution errors. Download the script, chmod it, then run.
- Systemd service quoting. If you manually edit the beszel-agent systemd service file, make sure the KEY environment variable has proper closing quotes. A missing quote causes the agent to crash with “no key provided” even though the key is technically in the file.
- Agents need to run on bare metal, not in containers. A DaemonSet agent can’t reliably access disk S.M.A.R.T., temperature sensors, or all network interfaces. Run the hub in Kubernetes, agents as systemd services.
DNS
- Never use .local for custom DNS records. It’s reserved for mDNS and will return SERVFAIL on most systems. Use .lan instead.
- Pi-hole v6 moved local DNS settings. The “Local DNS” menu from v5 is gone. In v6, add records under Settings → dns.hosts.
Troubleshooting
Headlamp: CrashLoopBackOff with session-ttl Error
Symptom: Pod crashes immediately. Logs show:
flag provided but not defined: -session-ttlFix: Remove the flag from the deployment:
kubectl get deploy headlamp -n infra -o json | \
  jq '.spec.template.spec.containers[0].args |= map(select(. != "-session-ttl=86400"))' | \
  kubectl apply -f -Code language: JavaScript (javascript)
Headlamp: 503 Service Temporarily Unavailable
Symptom: Ingress returns 503 from nginx.
Cause: Headlamp pod isn’t running (likely CrashLoopBackOff from the session-ttl bug).
Fix: Check pod status and logs:
kubectl get pods -n infra -l app.kubernetes.io/name=headlamp
kubectl logs -n infra -l app.kubernetes.io/name=headlamp --tail=20Code language: JavaScript (javascript)
Headlamp: “You don’t have permissions” After Token Refresh
Symptom: Dashboard loads but everything shows permission errors.
Cause: ClusterRoleBinding was deleted or points to a stale service account.
Fix:
kubectl delete clusterrolebinding headlamp-admin
kubectl create clusterrolebinding headlamp-admin \
  --clusterrole=cluster-admin \
  --serviceaccount=infra:headlamp-adminCode language: JavaScript (javascript)
Refresh the browser — no new token needed.
Beszel Agent: Crashes with “no key provided”
Symptom: Agent exits immediately. Journal shows:
Failed to load public keys: no key providedCode language: PHP (php)Cause: Either the SSH key isn’t in the systemd service file, or the KEY environment variable has a missing closing quote.
Fix:
cat /etc/systemd/system/beszel-agent.service | grep KEYVerify the line looks like:
Environment="KEY=ssh-ed25519 AAAA..."Code language: JavaScript (javascript)Both opening and closing double-quotes must be present. Fix, then:
sudo systemctl daemon-reload
sudo systemctl restart beszel-agent
Beszel: System Shows “Down” in Dashboard
Symptom: Agent is running on the node but Beszel UI shows red/down.
Cause: You added the system with a hostname (like ss-01.local) instead of an IP. The hub runs in a Kubernetes pod and can’t resolve mDNS hostnames.
Fix: Edit the system in Beszel UI and replace the hostname with the node’s IP address.
DNS: SERVFAIL for .local Domains
Symptom: dig headlamp.local returns SERVFAIL.
Cause: .local is reserved for Multicast DNS.
Fix: Use .lan instead. Update Pi-hole dns.hosts and Kubernetes Ingress rules accordingly.
Power Optimization Bonus
Since you’re running 3+ machines 24/7, power consumption matters. Here’s what I found:
My Ryzen 6800H nodes ship with amd-pstate-epp as the scaling driver, powersave governor, and balance_performance energy preference. This is the optimal configuration — the AMD firmware handles frequency scaling directly, clocking down to ~1.6GHz at idle and boosting to 4.7GHz within microseconds when a CI job hits.
Check your configuration:
cat /sys/devices/system/cpu/cpufreq/policy0/scaling_driver    # amd-pstate-epp
cat /sys/devices/system/cpu/cpu0/cpufreq/scaling_governor      # powersave
cat /sys/devices/system/cpu/cpu0/cpufreq/energy_performance_preference  # balance_performanceCode language: PHP (php)
If your governor is set to performance, switch to powersave. With amd-pstate-epp, this doesn’t mean slow — it means the firmware controls scaling instead of running at max frequency all the time. This alone can save 10-15W per node at idle.
What’s Next
This gives me two dashboards that cover everything I need:
- headlamp.lan — what’s running in the cluster, pod health, logs, events
- beszel.lan — how the machines are doing, temperatures, disk health, resource trends
No Prometheus scrape configs. No Grafana dashboard JSON. No AlertManager routing rules. Just two tools that do their jobs.
The next steps for the homelab are Cloudflare Tunnels for external access and deploying the actual application. But that’s for another post.
Monitored with one Beszel hub, four Beszel agents, one Headlamp deployment, and more systemctl restart commands than strictly necessary.
Leave a Reply