dedo started as a way to define an API once and serve it everywhere: Connect, gRPC, REST, docs and MCP tools for AI agents, from one .proto. This post is about something else: speed. Five kinds of it, each measured from scratch for this post on dedo v0.15.0:
- Fast to get started: an MCP server from an empty folder in three commands.
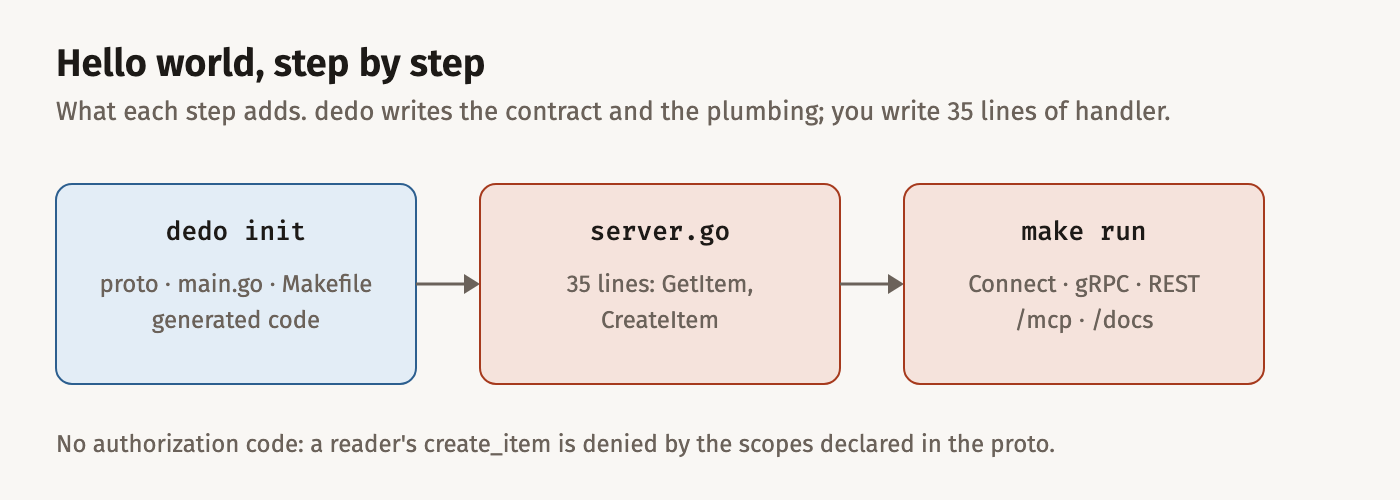
- Fast to use: a hello world is a proto file and 35 lines of Go.
- Fast to customize: your organisation’s own rule in five lines of YAML, live on the next lint.
- Fast to lint: 338 rules in 0.32 seconds.
- Fast to run: 12,718 authenticated MCP tool calls a second on one CPU core, and 25,339 on two, for the same call.
Every number below comes from a run you can repeat; the commands are at the end.
Fast to get started
Speed to start is not seconds on a clock: it is how few steps stand between you and a working server. With dedo it is three commands, after a one-time install:
go install github.com/raveesh-me/dedo/cmd/dedo@latest   # once per machine
go mod init example.com/hello
dedo init
make runCode language: Bash (bash)
dedo init on an empty module writes a starter service: a contract, main.go, server.go, buf.yaml, rules.yml, a Makefile and the guidance for coding agents. It pins the lint plugin, the code generators and the runtime as one release, generates the Go, Connect and MCP code and the REST docs, and tidies go.mod. make run serves it.
- No second tool to learn. Everything after
dedo initis amaketarget:make run,make generateafter a change to the proto,make checkbefore a commit. - No glue to write. Connect, gRPC, REST, the docs page and
/mcpall come from the one contract. - No rules to assemble. The linter arrives with Google’s AIPs, the Zalando guidelines and dedo’s own rules already chosen, in one
rules.yml.
Fast to use
The starter contract has two RPCs, GetItem and CreateItem, each with its scopes, error reasons and tool text declared in the proto. Until you write them, they answer Unimplemented. This is the whole of server.go for a working hello world:
package main

import (
	"context"
	"fmt"
	"sync"

	"connectrpc.com/connect/v2"
	"google.golang.org/protobuf/types/known/timestamppb"

	hellov1 "example.com/hello/gen/go/example/hello/v1"
)

// server keeps items in memory.
type server struct {
	mu    sync.Mutex
	items map[string]*hellov1.Item
}

func newServer() *server { return &server{items: map[string]*hellov1.Item{}} }

func (s *server) GetItem(_ context.Context, req *hellov1.GetItemRequest) (*hellov1.GetItemResponse, error) {
	s.mu.Lock()
	defer s.mu.Unlock()
	item, ok := s.items[req.GetName()]
	if !ok {
		return nil, connect.NewError(connect.CodeNotFound, "no item "+req.GetName())
	}
	return &hellov1.GetItemResponse{Item: item}, nil
}

func (s *server) CreateItem(_ context.Context, req *hellov1.CreateItemRequest) (*hellov1.CreateItemResponse, error) {
	s.mu.Lock()
	defer s.mu.Unlock()
	item := &hellov1.Item{
		Name:        fmt.Sprintf("items/%d", len(s.items)+1),
		DisplayName: req.GetItem().GetDisplayName(),
		CreateTime:  timestamppb.Now(),
	}
	s.items[item.Name] = item
	return &hellov1.CreateItemResponse{Item: item}, nil
}Code language: Go (go)
That is all the code. make run, and every transport is live:
curl -s localhost:8080/mcp -H 'Authorization: Bearer writer' \
  -H 'Content-Type: application/json' -H 'Accept: application/json, text/event-stream' \
-d '{"jsonrpc":"2.0","id":1,"method":"tools/call","params":{"name":"create_item","arguments":{"item":{"display_name":"hello, world"}}}}'Code language: Bash (bash){"item":{"name":"items/1","display_name":"hello, world","create_time":"2026-10-25T23:08:33.522926Z"}}Code language: JSON / JSON with Comments (json)There is no authorisation code in those 35 lines, yet a reader calling create_item gets PERMISSION_DENIED. The scopes come from the proto, and the same interceptors run for Connect, gRPC, REST and MCP.
The fastest way to get an MCP server running is to not write one. Write the contract, and the tools fall out of it.
Fast to customize
Every organisation has conventions no public standard knows: your REST root, your domain names, your field naming. With dedo, adding one is an edit to rules.yml, next to buf.yaml:
rules:
  - id: HOUSE_REST_ROOT
    on: method
    check: http_path == '' || http_path.startsWith('/commerce/')
    message: REST paths start with /commerce/, the commerce platform's root.Code language: YAML (yaml)
Save the file, and the next lint reports it, in the editor as you type and in CI, with your message beside the AIP, Zalando and dedo findings. What it takes, against what it used to:
| To add a convention | A lint plugin of your own | A dedo house rule |
|---|---|---|
| Write | A Go module against Buf’s plugin API | One CEL expression in rules.yml |
| Build and release | A binary, tagged and pinned in every repository | Nothing |
| Take effect | After every repository moves its pin | On the next lint: reading and checking the rules takes well under a millisecond |
| Share | Publish the plugin | Tag a git repository; services import it at the tag |
| Replace a standard rule | Turn it off in every buf.yaml | Name it in overrides, with the reason in the rule |
- Your rules outrank the standards. A service’s own rules outrank the shared ones it imports, which outrank dedo’s, the AIPs and Zalando’s. A rule replaces another only by naming it, so nothing changes by accident.
- Your platform team can lock a rule.
final: truemeans no service can override or disable it. - One file decides.
rules.ymlsays which rule sets run, which rules a service opts out of, and every override, andmake toolslists them all.
A convention used to be a wiki page and three reviewers. Now it is five lines, enforced on the next keystroke.
Part 4 covers house rules in depth, and rules.example.yml uses every key: several shared imports, opt-outs, overrides and a final rule.
Fast to lint
Lint runs on every keystroke in the editor, so its speed is the difference between findings that keep up and findings that lag. dedo’s linter runs Google’s AIPs, the Zalando guidelines dedo adopts, dedo’s own rules and your house rules in one Buf plugin.
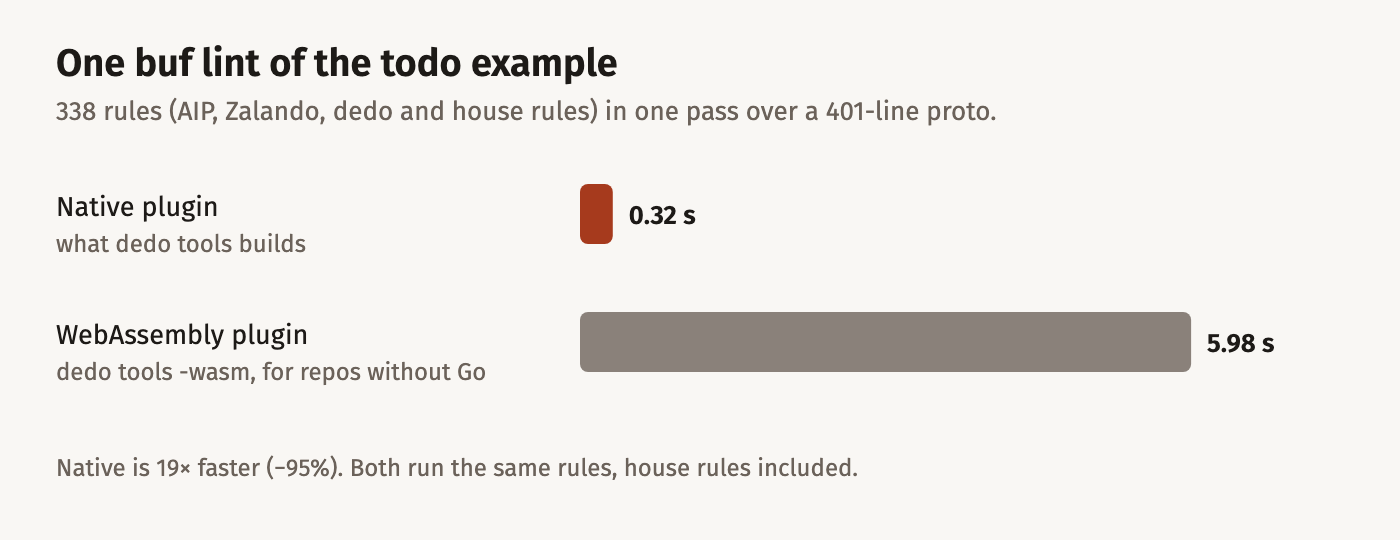
- 0.32 seconds for 338 rules over the todo example’s 401-line contract, its house rules among them, with the native plugin
dedo toolsbuilds. - 19× faster (−95%) than the same plugin and rules as WebAssembly (5.98 s), which
dedo tools -wasmbuilds, withrules.ymlinside, for repositories without Go. - Well under a millisecond to read
rules.ymland its imports and check every override, so an edit takes effect on the next lint.
Fast to run
This is the part I set out to measure properly. The question: what does an MCP tool call cost? I compared three ways of serving the same tools, each server in its own container with one CPU and 1 GiB:
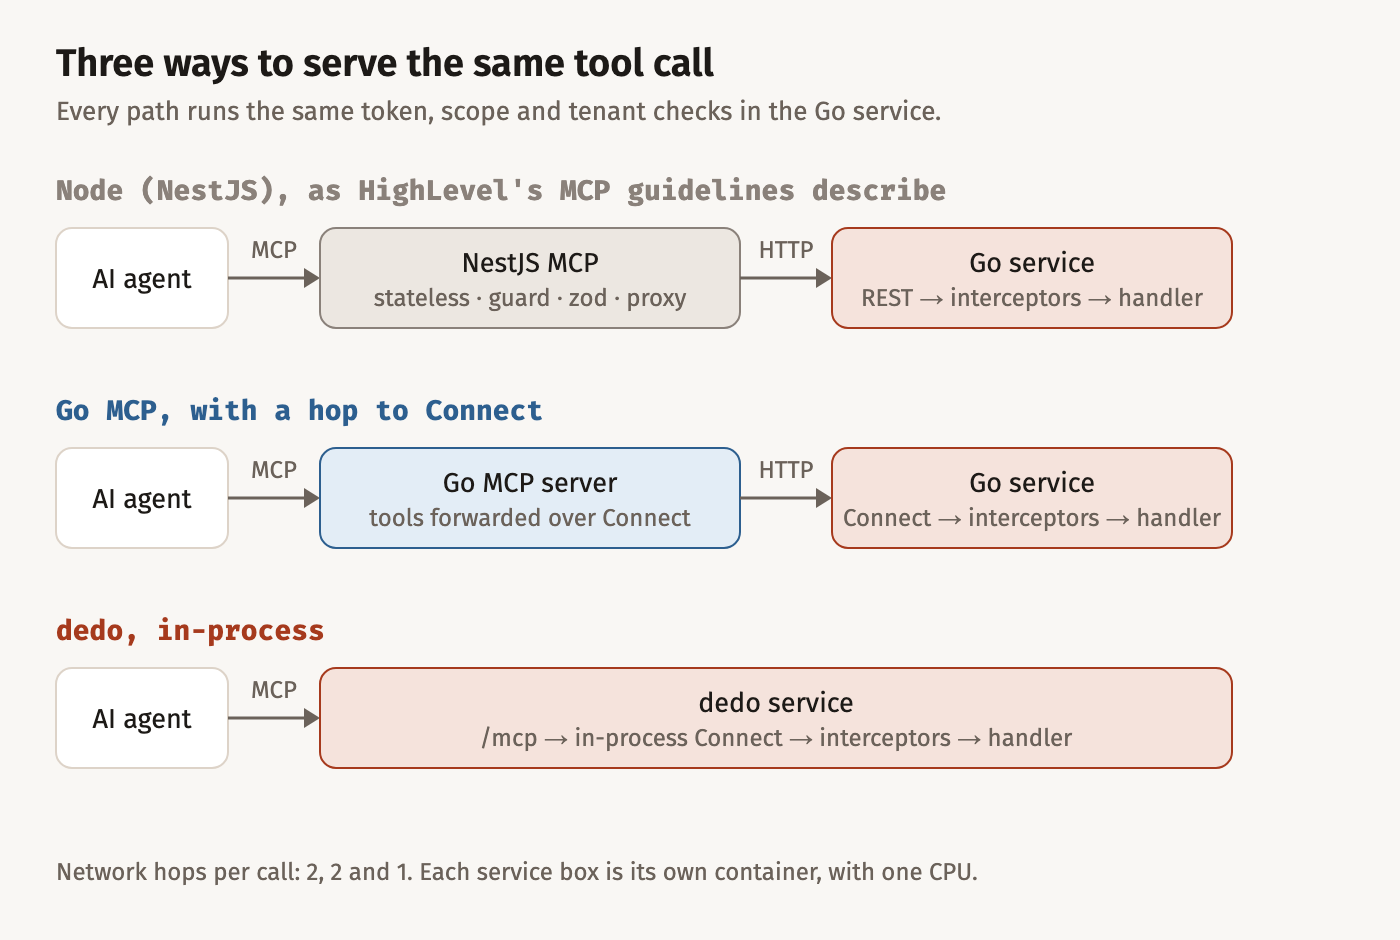
- Node (NestJS) → REST: a NestJS MCP server built the way HighLevel’s MCP guidelines describe one, run stateless as dedo is: a server per request, a constant-time bearer guard, zod validation, a central
handleToolCall, and handlers that proxy to the service’s REST API. NestJS 12 on Node 22. - Go MCP → Connect: a Go MCP server on the official MCP Go SDK, in its own container, forwarding each tool call to the service over Connect: what you get by putting a Go MCP layer in front of an existing service.
- dedo: the service serves
/mcpitself, and each tool call goes straight to itsconnect.Server, in the same process.
In all three, the same Go service answers, with the same interceptors: token, scopes, tenant, flow IDs, error audit. A load driver in its own container calls with a real bearer token and stops on any failed call, so every number counts only calls that passed the security checks. Two apps: a todo service, and a multi-tenant contacts service whose every call is checked against the caller’s location, nested references included.
Throughput
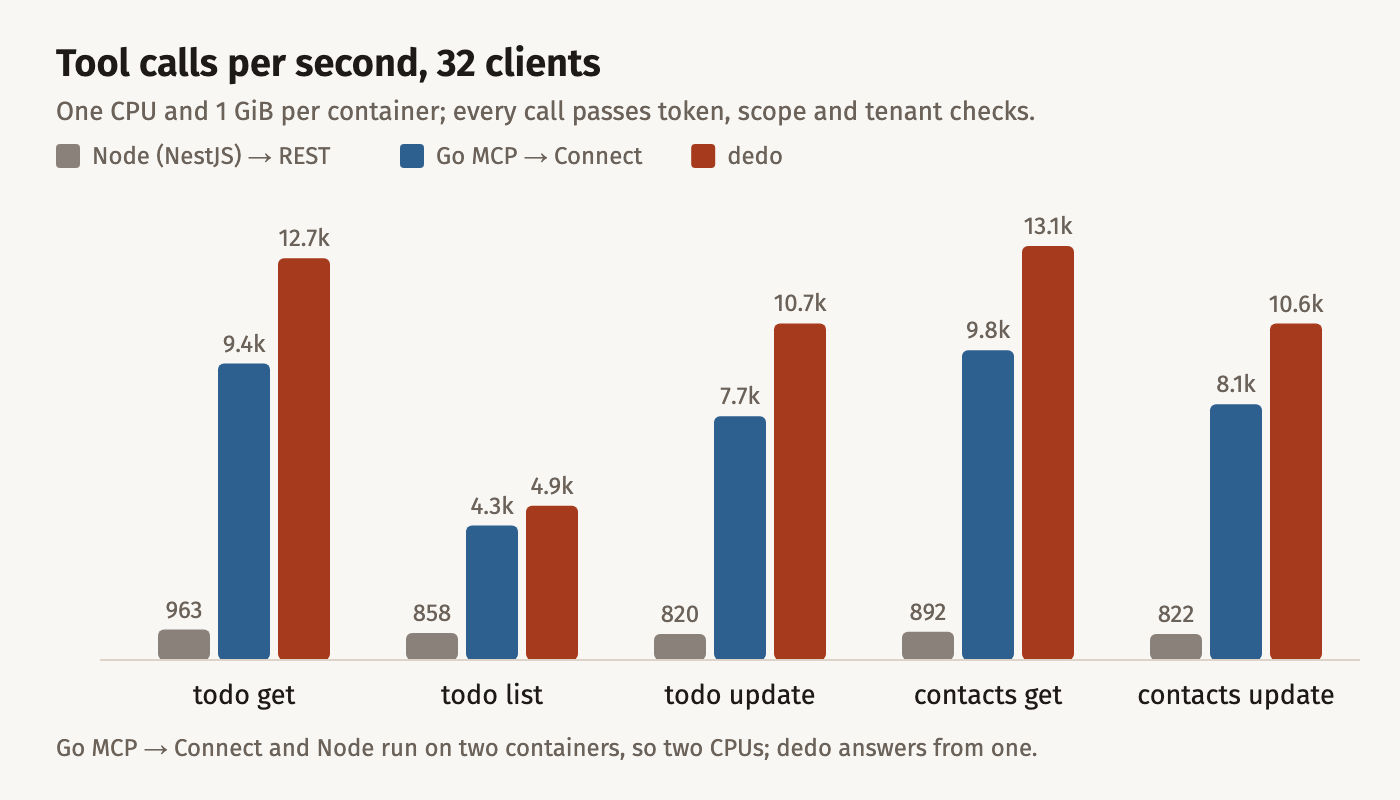
| 32 clients, 1 CPU per container | Node (NestJS) → REST | Go MCP → Connect | dedo | dedo vs Node |
|---|---|---|---|---|
| todo get | 963/s | 9,383/s | 12,718/s | 13.2× |
| todo list | 858/s | 4,255/s | 4,884/s | 5.7× |
| todo update (field mask) | 820/s | 7,718/s | 10,654/s | 13.0× |
| contacts get (tenant-checked) | 892/s | 9,804/s | 13,101/s | 14.7× |
| contacts update (nested reference) | 822/s | 8,092/s | 10,650/s | 13.0× |
13,101 tool calls a second on one CPU core, for a tenant-checked contacts get, every one authenticated, scope-checked and tenant-checked. For a get, dedo serves 13.2× Node’s throughput and +36% over the Go MCP server, though both of those have two containers, so two CPUs, to dedo’s one.
CPU per call
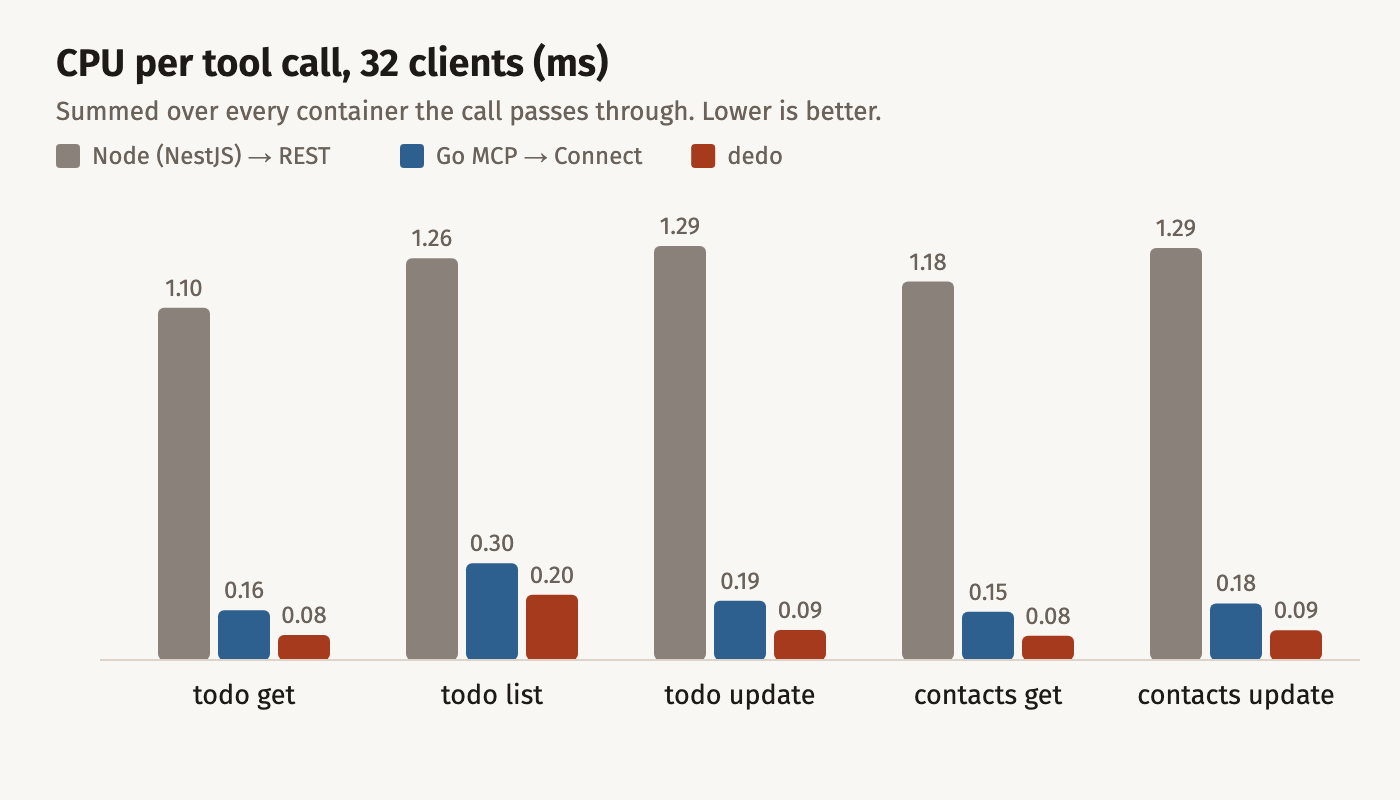
CPU per call is what you pay for. For a get, dedo spends 0.078 ms against Node’s 1.102 ms: −93%. The Go MCP server with its hop spends 0.155 ms, so dropping the hop saves 50% of the CPU of every call.
Latency
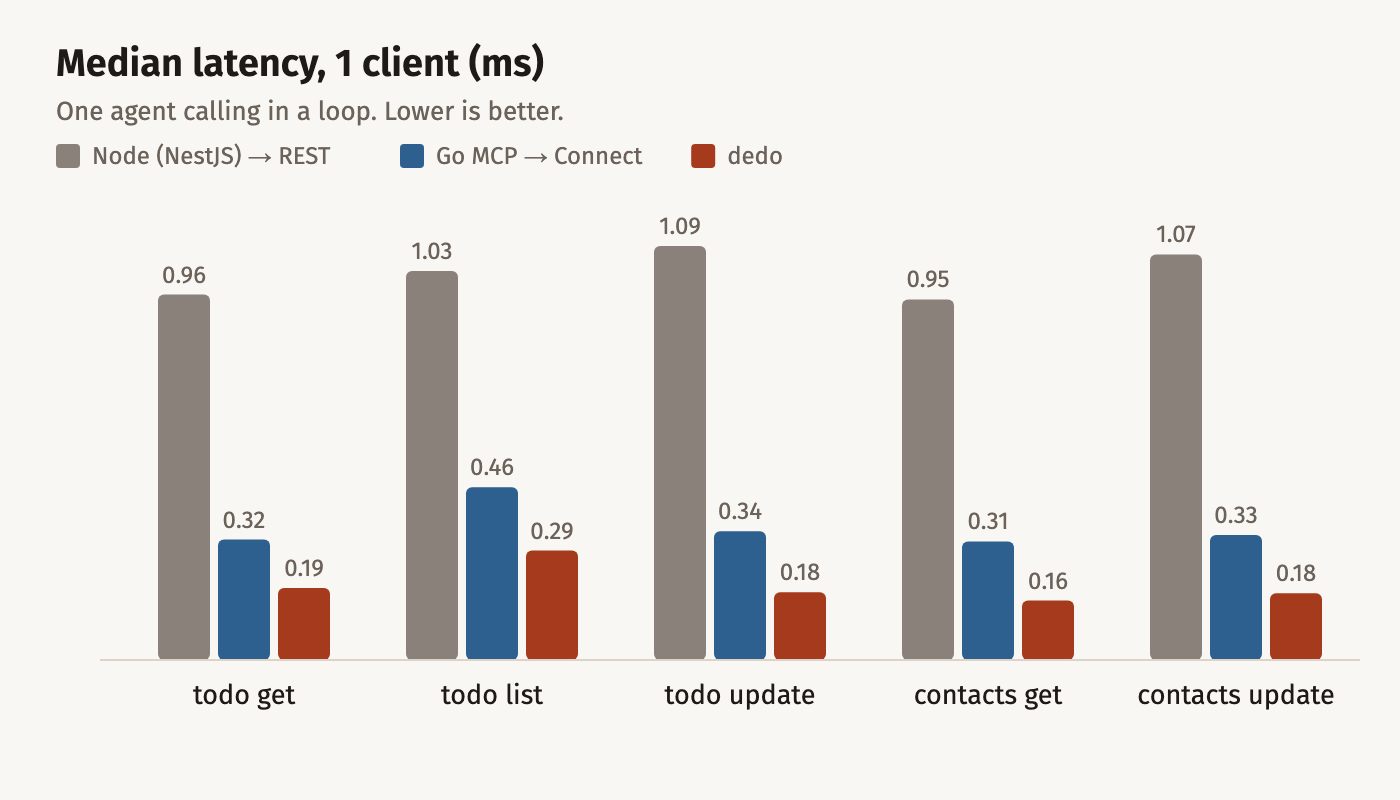
One agent calling in a loop sees a median of 0.19 ms per tool call with dedo: −80% against Node’s 0.96 ms, and −40% against the Go MCP server’s 0.32 ms.
Tail latency, and what a second core does
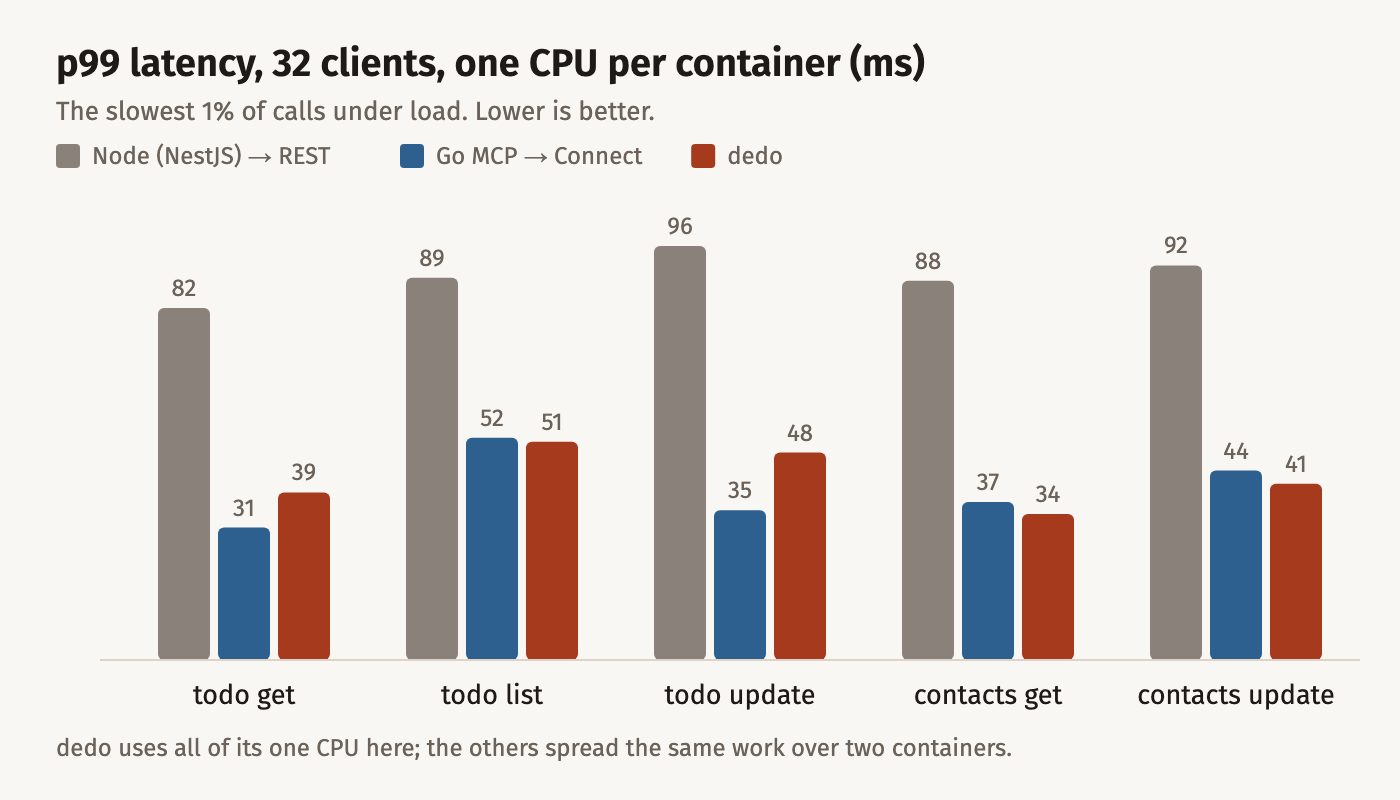
The slowest 1% of calls tells a different story. With one CPU each, dedo’s p99 is 34 to 51 ms, the Go MCP server’s 31 to 52 ms, and Node’s 82 to 96 ms. dedo is ahead on throughput and median, so why is its tail no better than the Go MCP server’s?
- dedo uses all of its CPU. At 32 clients, dedo’s container uses 1.00 of its one CPU: all of it. The Go MCP variant spreads 1.46 CPUs of work over two containers, so neither is full.
- A full container gets paused. A container limited to one CPU may use 100 ms of CPU time in every 100 ms period. A Go program uses more than one thread, for the garbage collector and the network, so a busy one can use up its allowance early in a period, and Linux then holds the whole container until the next one. Every call in flight waits: that is the tail.
- It is not the load driver. It used 0.55 of its 2 CPUs at dedo’s peak; nothing else on the machine used more than 0.05.
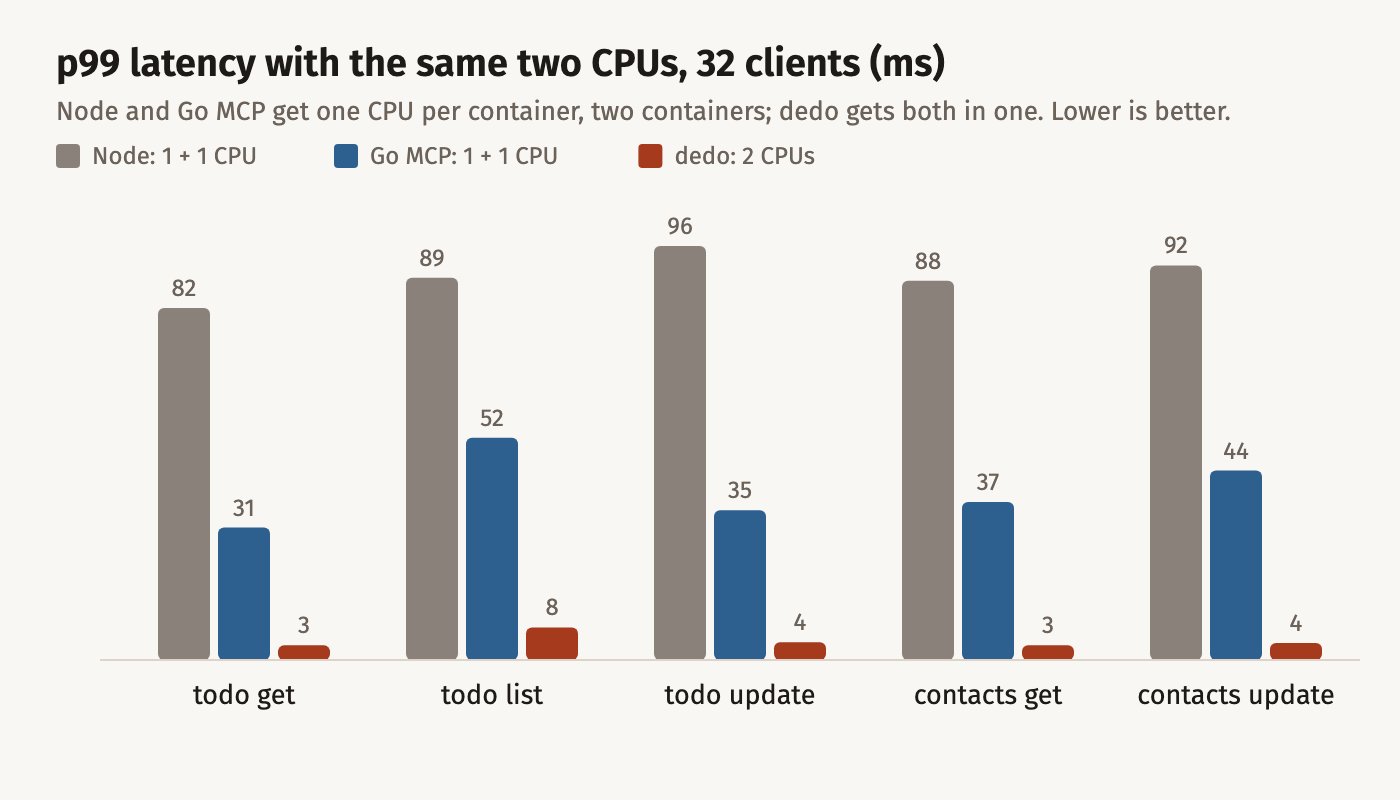
So the fair question is what each design does with the same CPUs. Node and the Go MCP server already use two, one per container. Give dedo the same two:
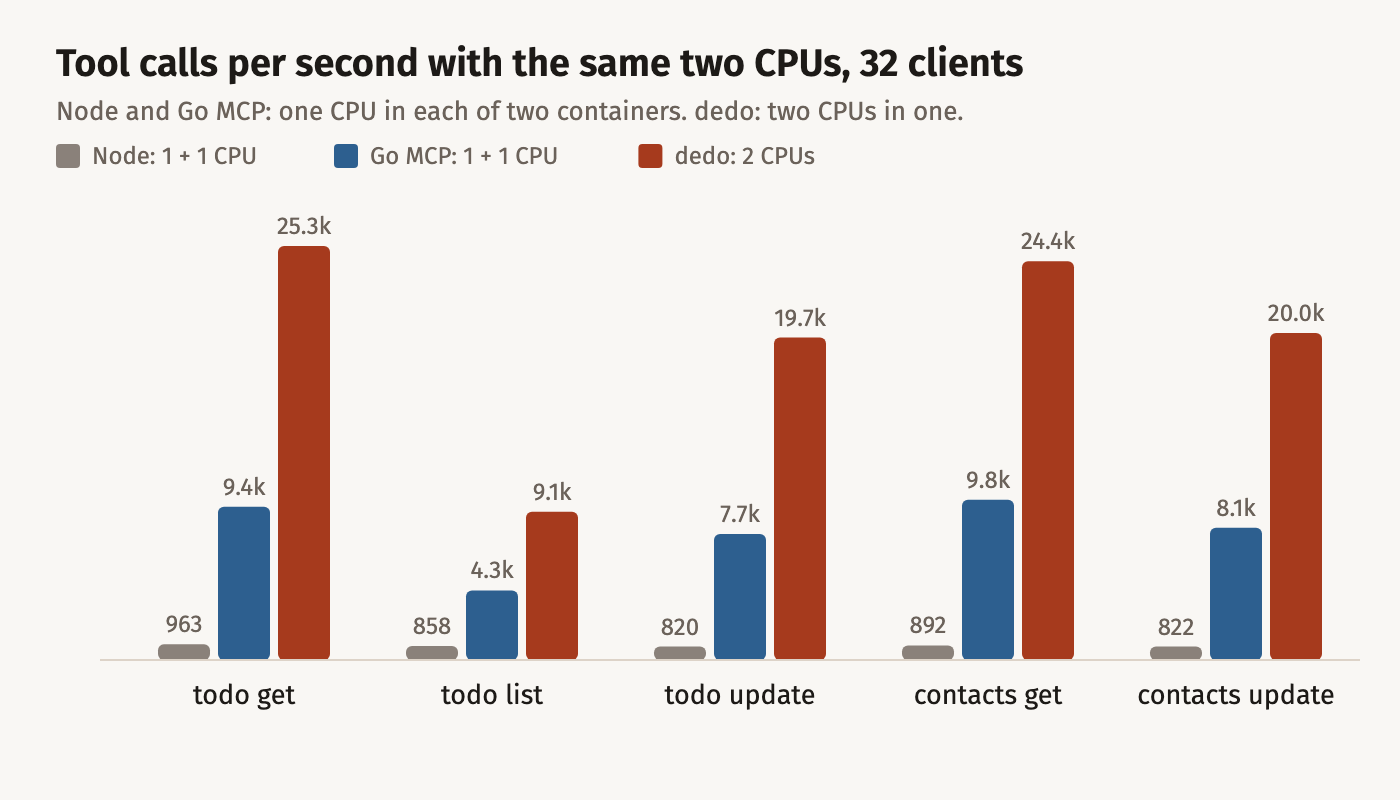
| 32 clients, 2 CPUs each | Node (NestJS) → REST (1 + 1) | Go MCP → Connect (1 + 1) | dedo (2) | dedo vs Node | dedo vs Go MCP |
|---|---|---|---|---|---|
| todo get | 963/s, p99 82 ms | 9,383/s, p99 31 ms | 25,339/s, p99 3 ms | 26.3× | 2.7× |
| todo list | 858/s, p99 89 ms | 4,255/s, p99 52 ms | 9,077/s, p99 8 ms | 10.6× | 2.1× |
| todo update (field mask) | 820/s, p99 96 ms | 7,718/s, p99 35 ms | 19,740/s, p99 4 ms | 24.1× | 2.6× |
| contacts get (tenant-checked) | 892/s, p99 88 ms | 9,804/s, p99 37 ms | 24,408/s, p99 3 ms | 27.4× | 2.5× |
| contacts update (nested reference) | 822/s, p99 92 ms | 8,092/s, p99 44 ms | 20,013/s, p99 4 ms | 24.4× | 2.5× |
With the same two CPUs, dedo serves 25,339 tool calls a second for a todo get, and its p99 falls to 3 to 8 ms, against the Go MCP server’s 31 to 52 ms and Node’s 82 to 96 ms. On the same CPUs, that is 11× to 27× Node’s throughput. A second core takes dedo out of the pauses, while the Go MCP server spends its second CPU on the hop. The lesson for production is the usual one: leave headroom. A server pinned at 100% of its CPU limit pays for it in the tail, whatever it is written in.
In a cluster: the cost of the hop
Every hop above stays on one machine, between containers on podman’s virtual network: no physical network, no TLS, no load balancer. That is the cheapest a hop gets. In Kubernetes, an MCP server in front of a service makes a pod-to-pod call, often to another node, through a Service, and with a service mesh through two more proxies and TLS.
To see what that costs, I ran everything again with Toxiproxy on the hop from each MCP server to the service, delaying every response by 3 to 5 ms. dedo has no hop, so nothing changes for it:
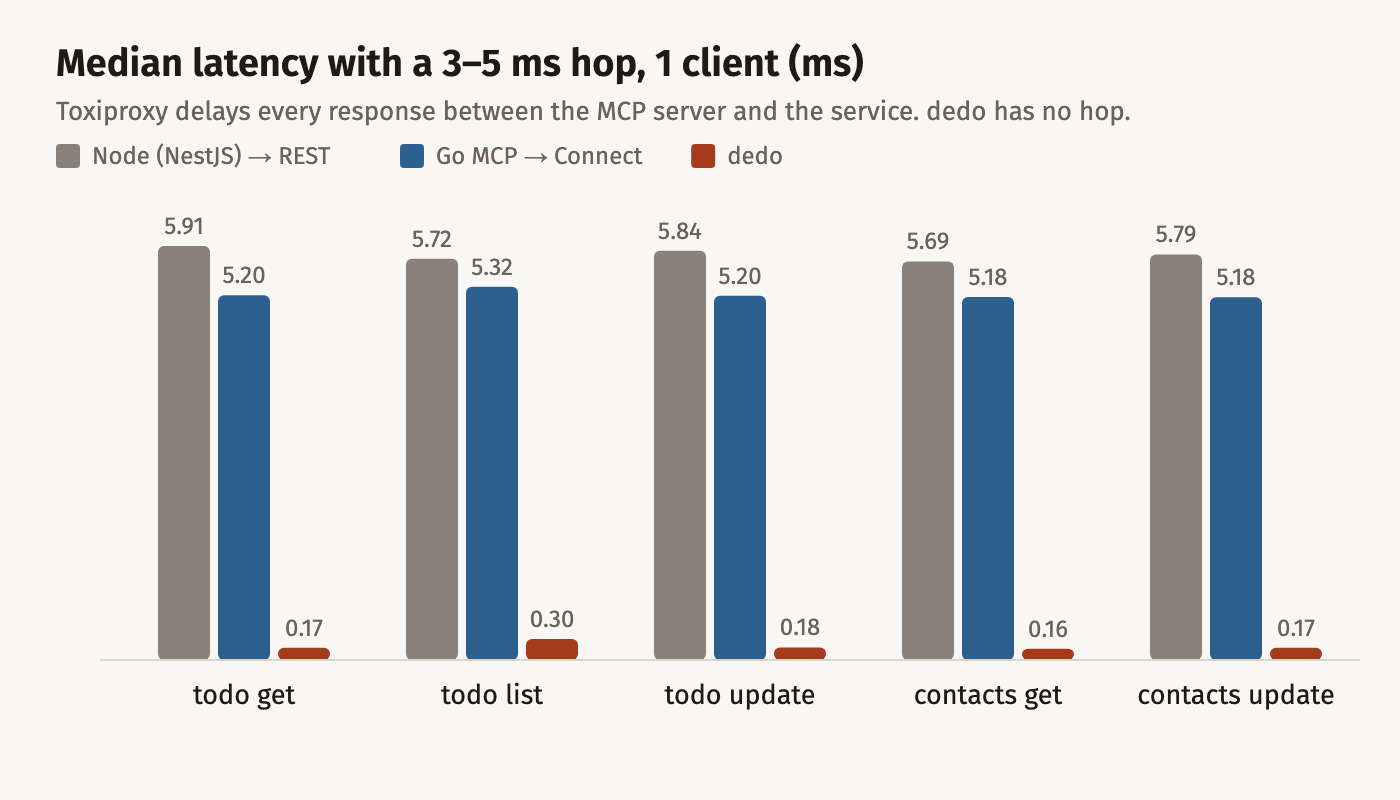
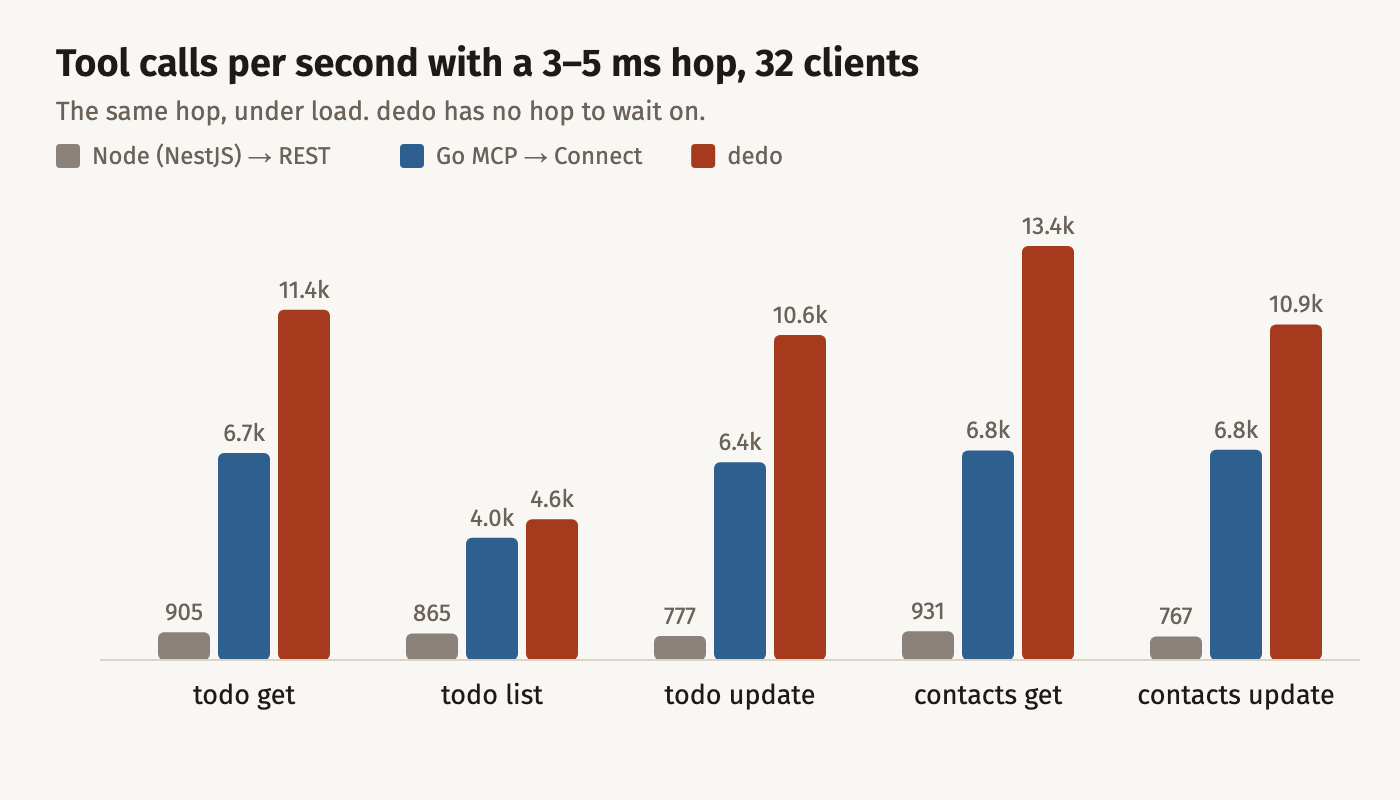
With the hop, one agent waits a median of 5.2 ms per tool call through the Go MCP server and 5.9 ms through Node, against dedo’s 0.17 ms: the hop adds about 4.9 ms to every call, Toxiproxy’s own relay included. Under load, the Go MCP server falls to 6,727 calls a second and Node to 905, while dedo serves 11,384. An agent that makes a dozen tool calls to answer one question waits for every one of them.
The hop has one more effect, on the tail. While a call waits on it, the Go MCP server’s containers sit idle, so they never reach their CPU limit, and its p99 falls to 7 to 26 ms. dedo, on one CPU and running flat out at 11,384 calls a second, keeps its 41 to 50 ms tail; with a second core, as above, it drops to 3 to 8 ms.
Memory
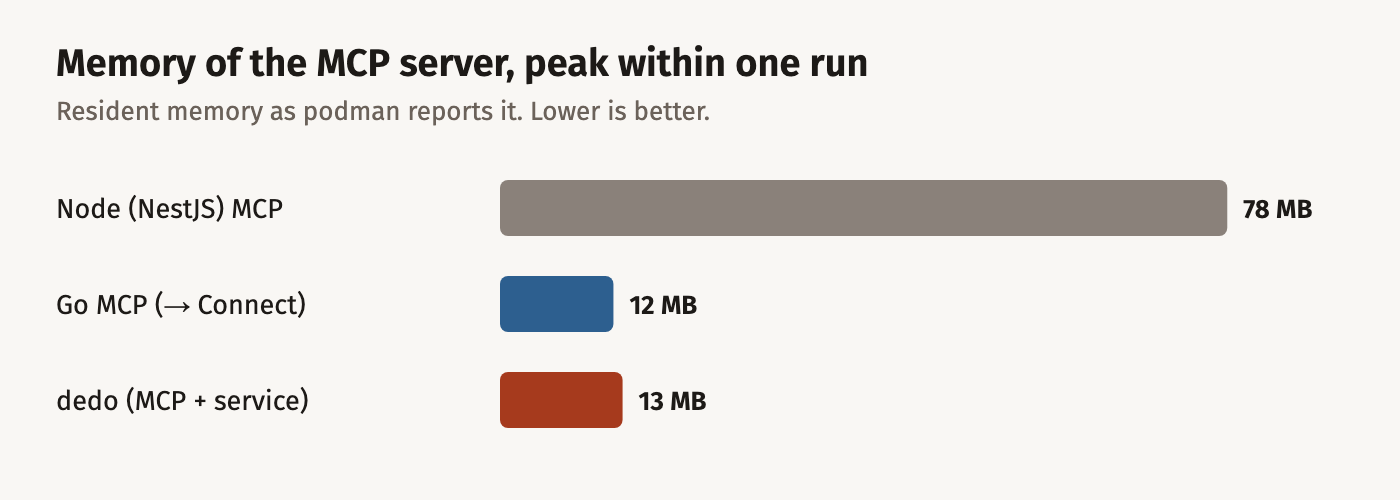
Within a 25-second run, the Node server reached 78 MB; dedo, MCP and service together, stayed at 13 MB: −83%.
Statelessness matters here too. Run the way the guidelines describe, with every MCP session kept in memory for 30 minutes, the Node server stopped after about five back-to-back runs with FATAL ERROR: … JavaScript heap out of memory: V8’s default heap of about 512 MB, inside a 1 GiB container. Stateless, as measured here, it holds steady. dedo keeps no sessions at all.
Where the speed comes from
Two things. First, no hop: an MCP tool call in dedo is a function call into the service’s own connect.Server, through the same interceptors as every other transport. Second, JSON decoding: profiling dedo found that most of a tool call’s cost was not dedo at all, but how the MCP Go SDK decodes JSON.
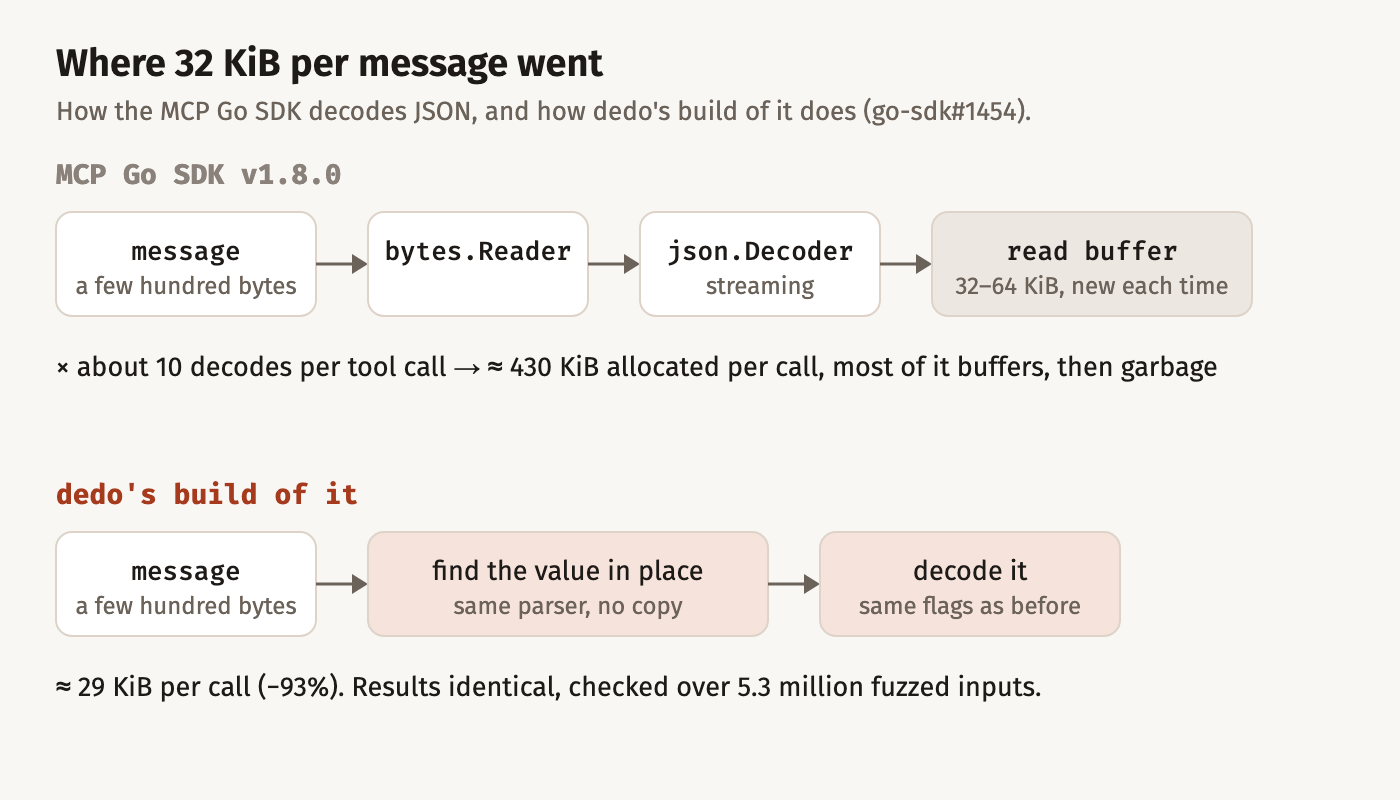
Every decode wrapped a few hundred bytes in a streaming decoder with a 32 KiB read buffer, about ten times per tool call. That made 90% of the memory a tool call allocated, and the garbage collector took 28% of the CPU. The fix finds the value in place with the same parser and decodes it with the same flags: −93% memory per call. A differential test compares both paths, and 5.3 million fuzzed inputs found no difference in results, errors included.
The fix is proposed upstream as go-sdk#1454. Until a release has it, dedo init points services at a build of the SDK with the fix, with a comment saying why, and a later dedo removes the line once upstream catches up.
How this was measured
- Hardware: Apple M1 Max; containers in a podman VM with 4 CPUs. Each server container: 1 CPU and 1 GiB, or 2 CPUs where marked, started fresh for every measurement. The load driver: its own container, 2 CPUs.
- Software: dedo v0.15.0, Go 1.26.6, the MCP Go SDK, NestJS 12.2 on Node 22, Toxiproxy 2.12.0; MCP over streamable HTTP with JSON responses.
- Runs: 5 s warm-up, then 20 s measured, at 1 and 32 concurrent clients. CPU is each container’s CPU time over the run, per call. Lint: the median of 15 native and 5 WebAssembly runs of
buf lint. - Fairness: all three servers are stateless, so each pays for its per-call setup, as the latest MCP specification has every server do. Every call carries a real token and passes scope and tenant checks; the run stops on any failed call.
- Hops: on one machine, unless Toxiproxy adds 3 to 5 ms; a real network costs more.
git clone https://github.com/raveesh-me/dedo && cd dedo
bench/mcp/run.sh                                  # all apps, all three servers, 1 CPU each
CPUS=2 VARIANTS=inprocess bench/mcp/run.sh        # dedo with two CPUs
HOP_LATENCY=3-5 bench/mcp/run.sh                  # a 3-5 ms hop in front of each MCP serverCode language: Bash (bash)
Define once, deploy everywhere, and fast at every step on the way.
The dedo series
- Part 1: Define Once, Deploy Everywhere: why one proto can carry the contract and its rules.
- Part 2: Getting Started with Todo Good and Todo Bad: two services, one interface, and what each lint rule protects you from.
- Part 3: Adding dedo to an Existing Service: one layer at a time, with an audit mode before you enforce.
- Part 4: House Rules, Your Conventions as Lint: your organisation’s conventions as CEL checks, shared from one repository.
- Part 5: Multi-Tenant SaaS Auth: the tenant boundary, declared in the proto and enforced on every transport.
- Part 6: How fast is Dedo? (this post): what dedo costs and saves, measured: getting started, lint, and MCP tool calls a second.
Leave a Reply